AI slop slides: what they look like and what real consulting slides do instead
AI slop on a slide is a finished look with no finding behind it. A baseline from 1,703 public consulting slides, and the same numbers built twice.
AI slop on a slide is a finished look with no finding behind it. Real consulting slides give a baseline: across 1,703 public McKinsey, BCG and Bain slides I measured, the median title runs 11 words, 0.4% of titles are in capitals, and 0 of 27 sampled chart slides have gridlines.
Below, four pairs build the same real numbers twice: once as a composite I stacked with common tells on purpose, once as a clean slide built with Decky AI, the PowerPoint agent that publishes this blog. If someone has just told you your deck looks AI-made, go to the six checks first.
What does AI slop look like on a slide?
AI slop on a slide looks competent and says nothing you could act on: the formatting is finished and the finding is missing. Merriam-Webster, which made “slop” its 2025 word of the year, defines it as “digital content of low quality that is produced usually in quantity” by means of AI (AP report). The closer fit for a slide is a position paper by Kommers and colleagues in ACM AI Letters, whose first feature of slop is superficial competence: “its veneer of quality is belied by a deeper lack of substance”.
I built each composite myself, stacking tells that ranking guides list (accent bars, eyebrow labels, stat tiles, rows of identical cards) and adding emoji as icons. These composites are teaching exhibits and show nothing about what any AI tool produces, since a comparison built to lose proves nothing about a product. Read them as anatomy; the evidence is the measurement further down. The clean slide of each pair is built with Decky AI from the brief in the market entry guide. Both slides use the same real Eurostat figures; the German furniture retailer and its plans are fictional.
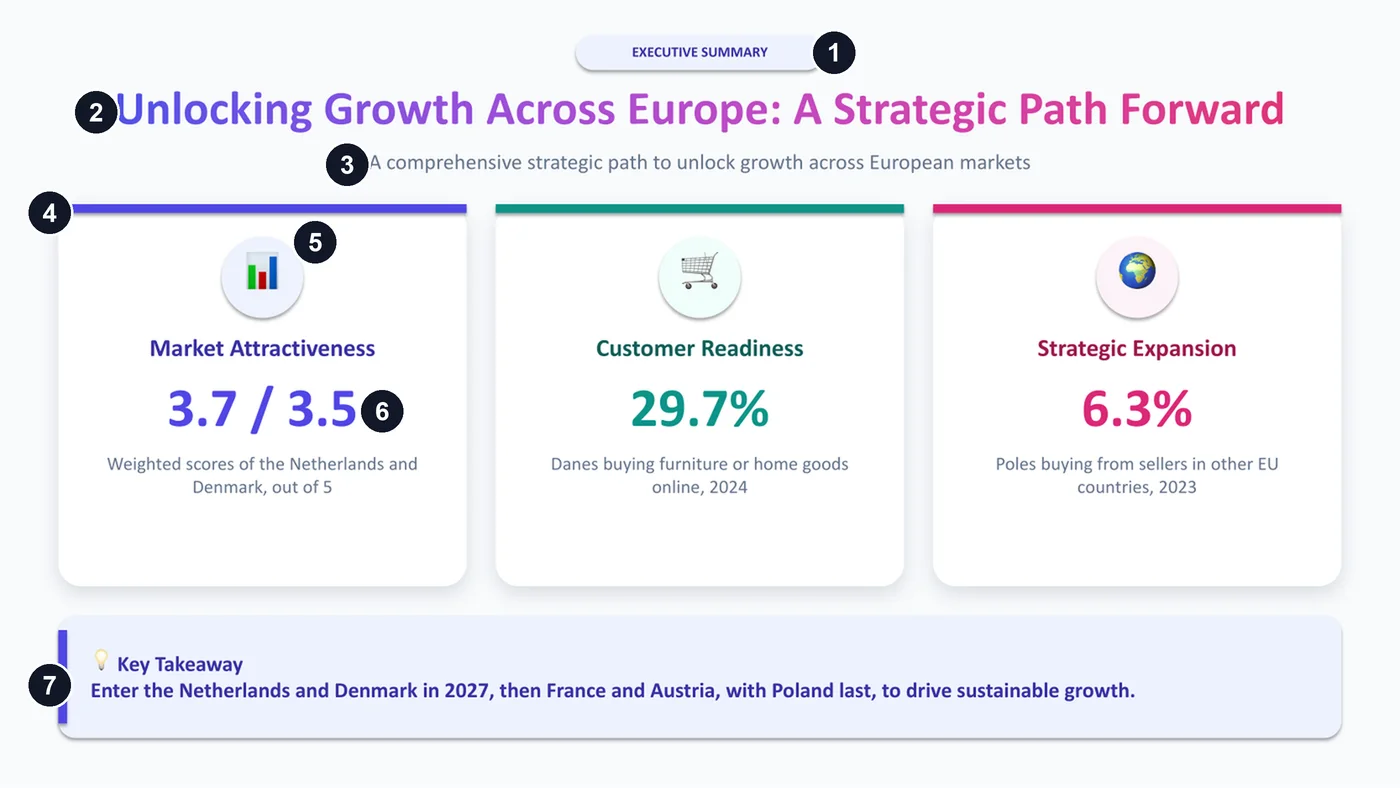
- A pill label above the title, which names the page type and adds nothing.
- A title in gradient text that names a theme and would fit any company.
- A subtitle repeating the title.
- Three identical cards, a colour bar and a hue each, with the colours encoding nothing.
- An emoji in a tinted circle, standing in for an icon.
- A big number on every card, all of equal weight, so the eye has no focal point.
- A takeaway in a tinted box with an accent stripe and same-hue text, closing on “to drive sustainable growth”.
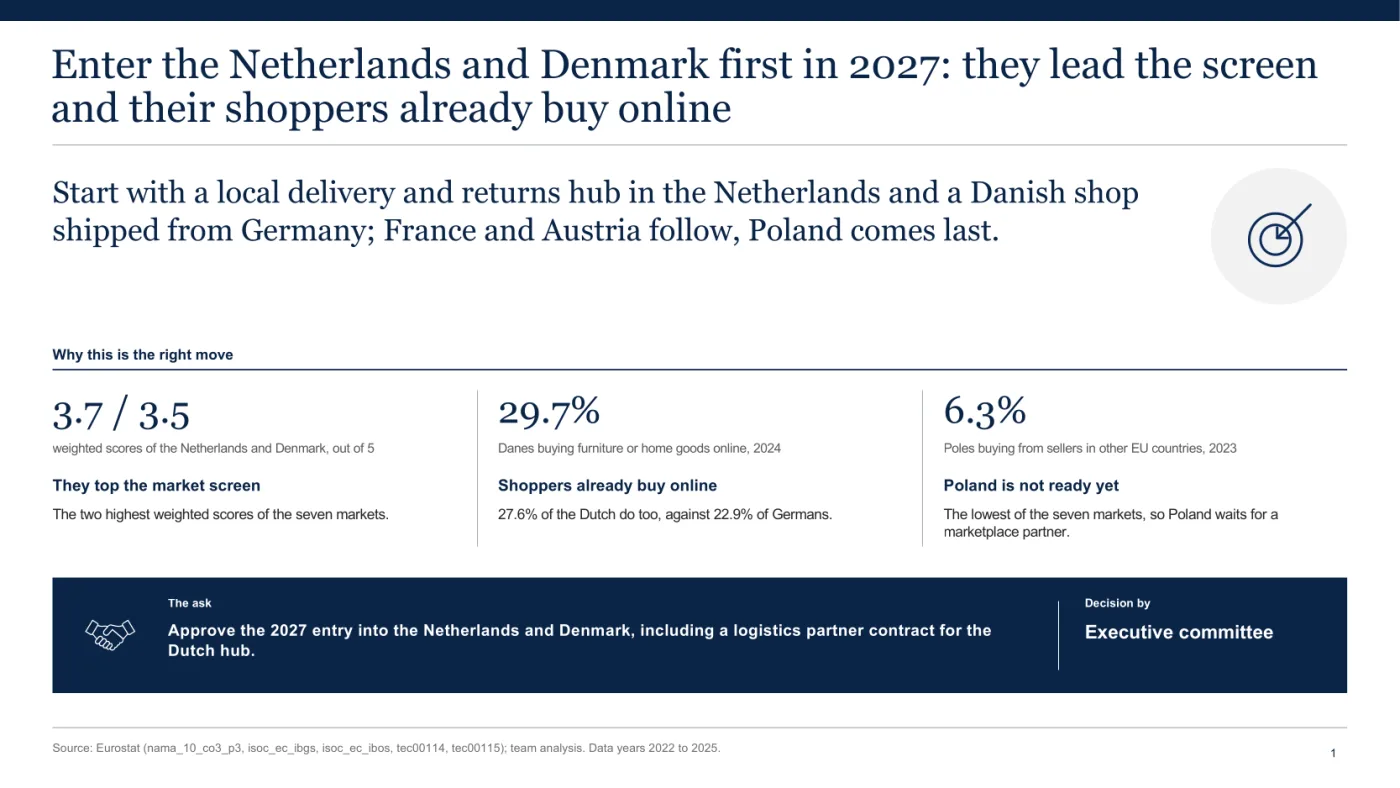
The clean slide gives those numbers a job. Its title states the recommendation, enter the Netherlands and Denmark first in 2027, and the sentence below says how each market is entered. Three proof figures follow, the market scores and the survey shares with their years, and the page ends on the decision asked for and who takes it. It has icons and a dark accent panel too, so neither of those is the tell.
How does a slop slide differ from a clean one on the same numbers?
The figures stay and the page starts to say something: the title states the finding and the layout ranks the evidence. Three more pairs show it on a chart, a table and a roadmap.
On a chart, the title carries the finding
The data here is Eurostat’s share of people buying from sellers in other EU countries, for seven markets in 2023.
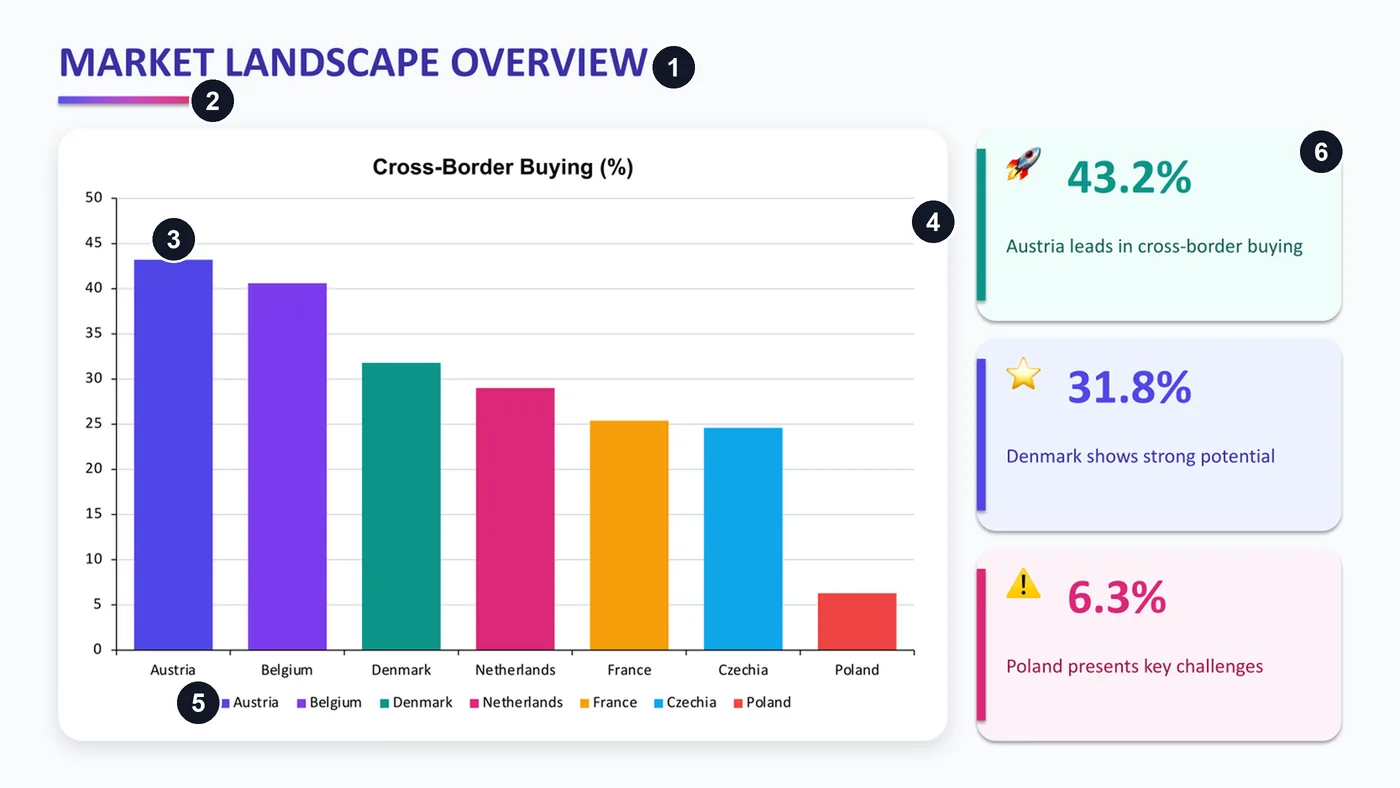
- A title in capitals that names a topic.
- A short gradient underline that does nothing.
- A colour per bar: seven colours that encode nothing, since the axis already names the bars.
- Gridlines and a scale, with no values on the bars.
- A legend repeating the axis.
- Stat tiles with a stripe and an emoji, and a claim like “Denmark shows strong potential” that no number on the slide supports.
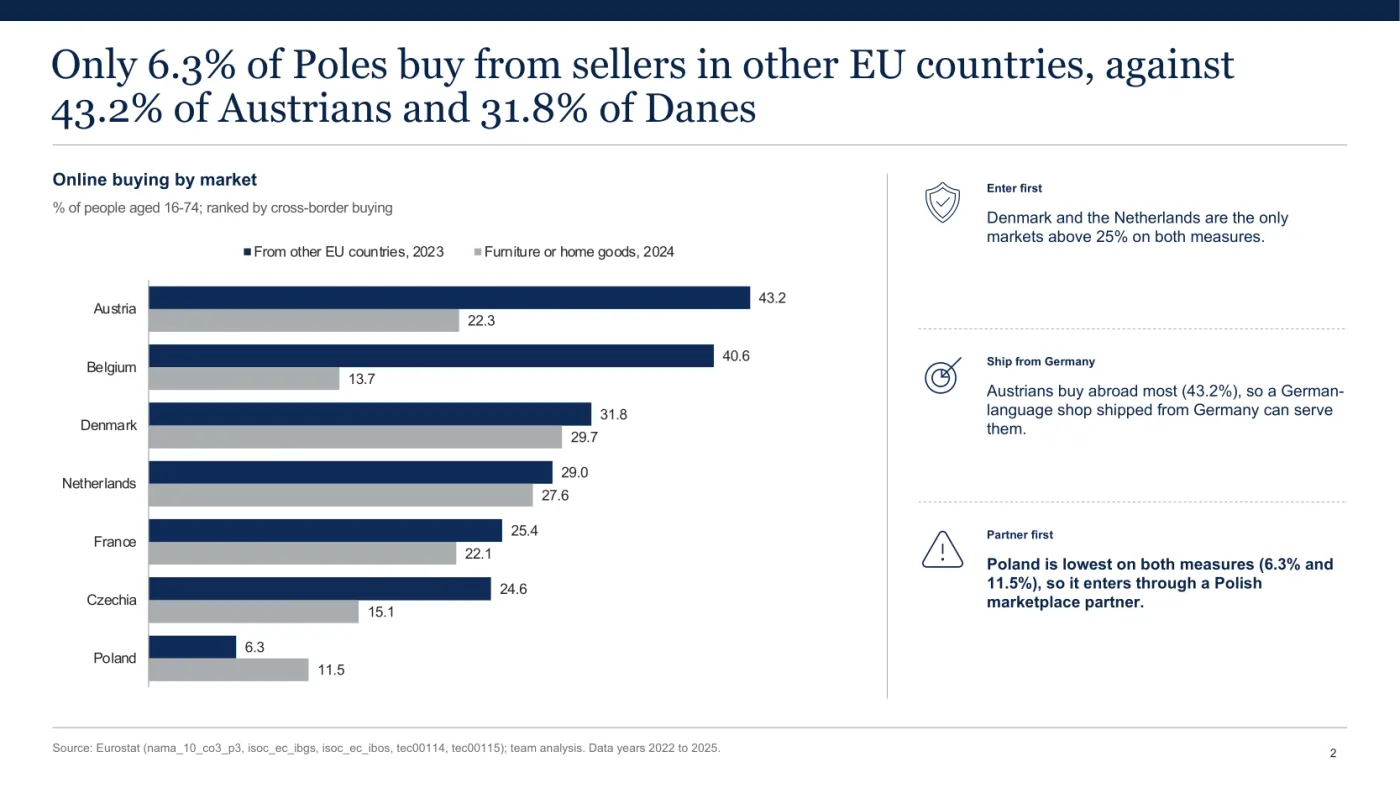
The clean title is the finding: only 6.3% of Poles buy from sellers in other EU countries, against 43.2% of Austrians. The bars are ranked, two series sit side by side with values on the bars and no gridlines, and three readouts say what to do about it, above a source line naming the datasets.
On a scorecard, the result belongs in the title
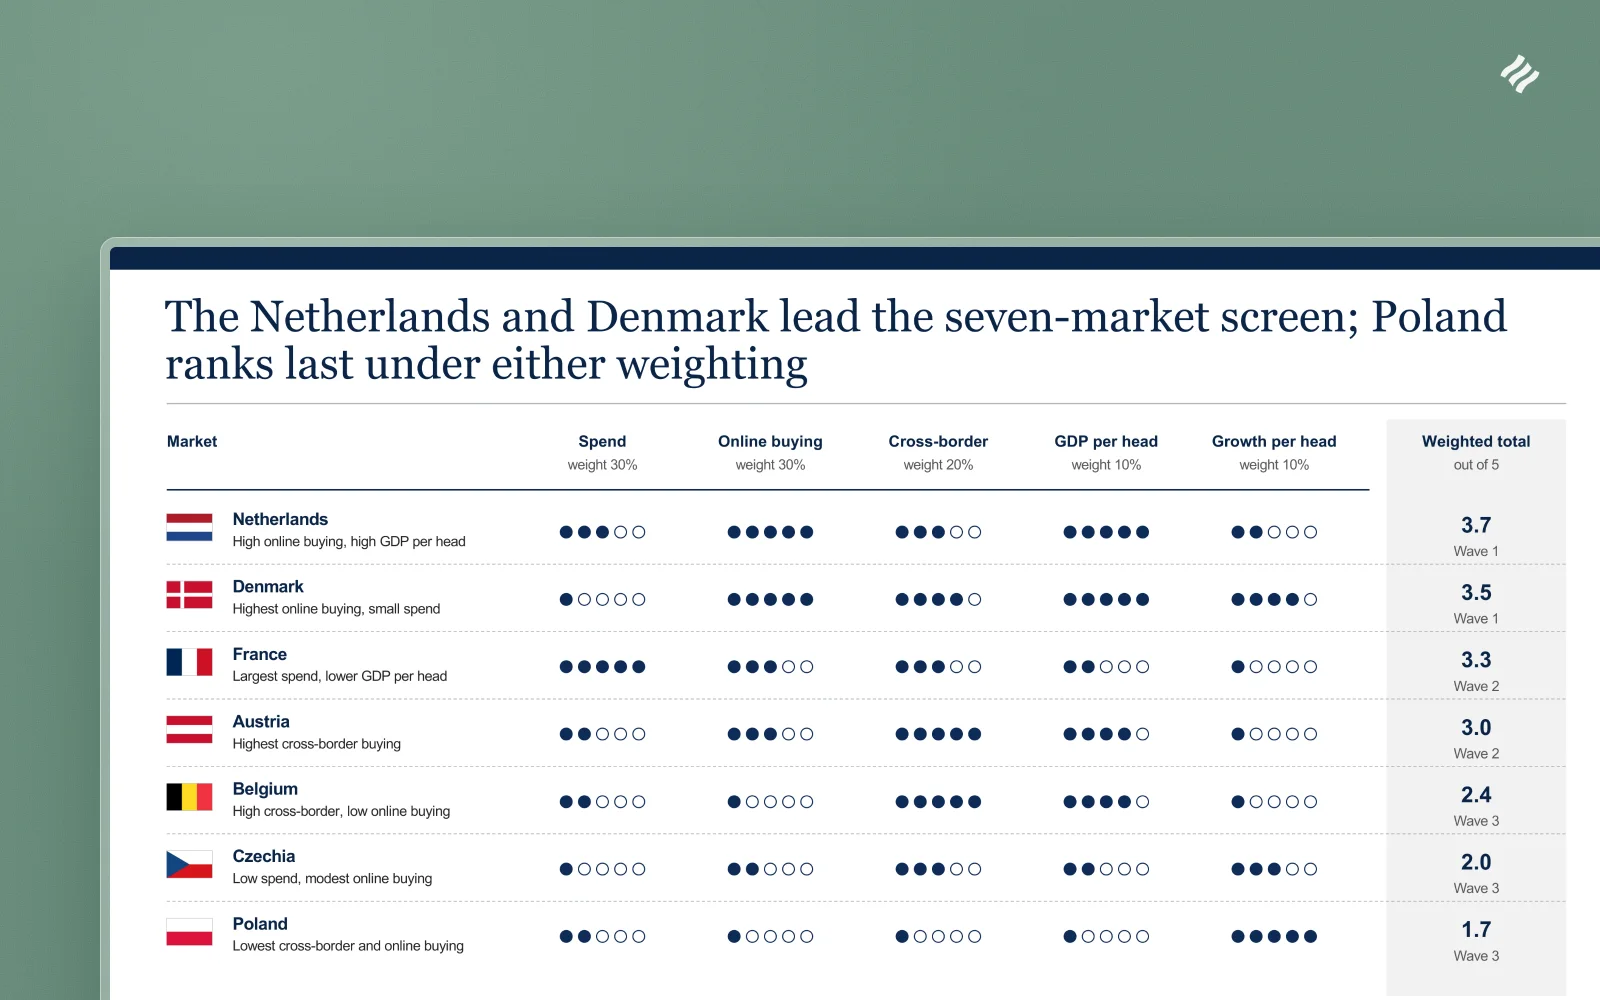
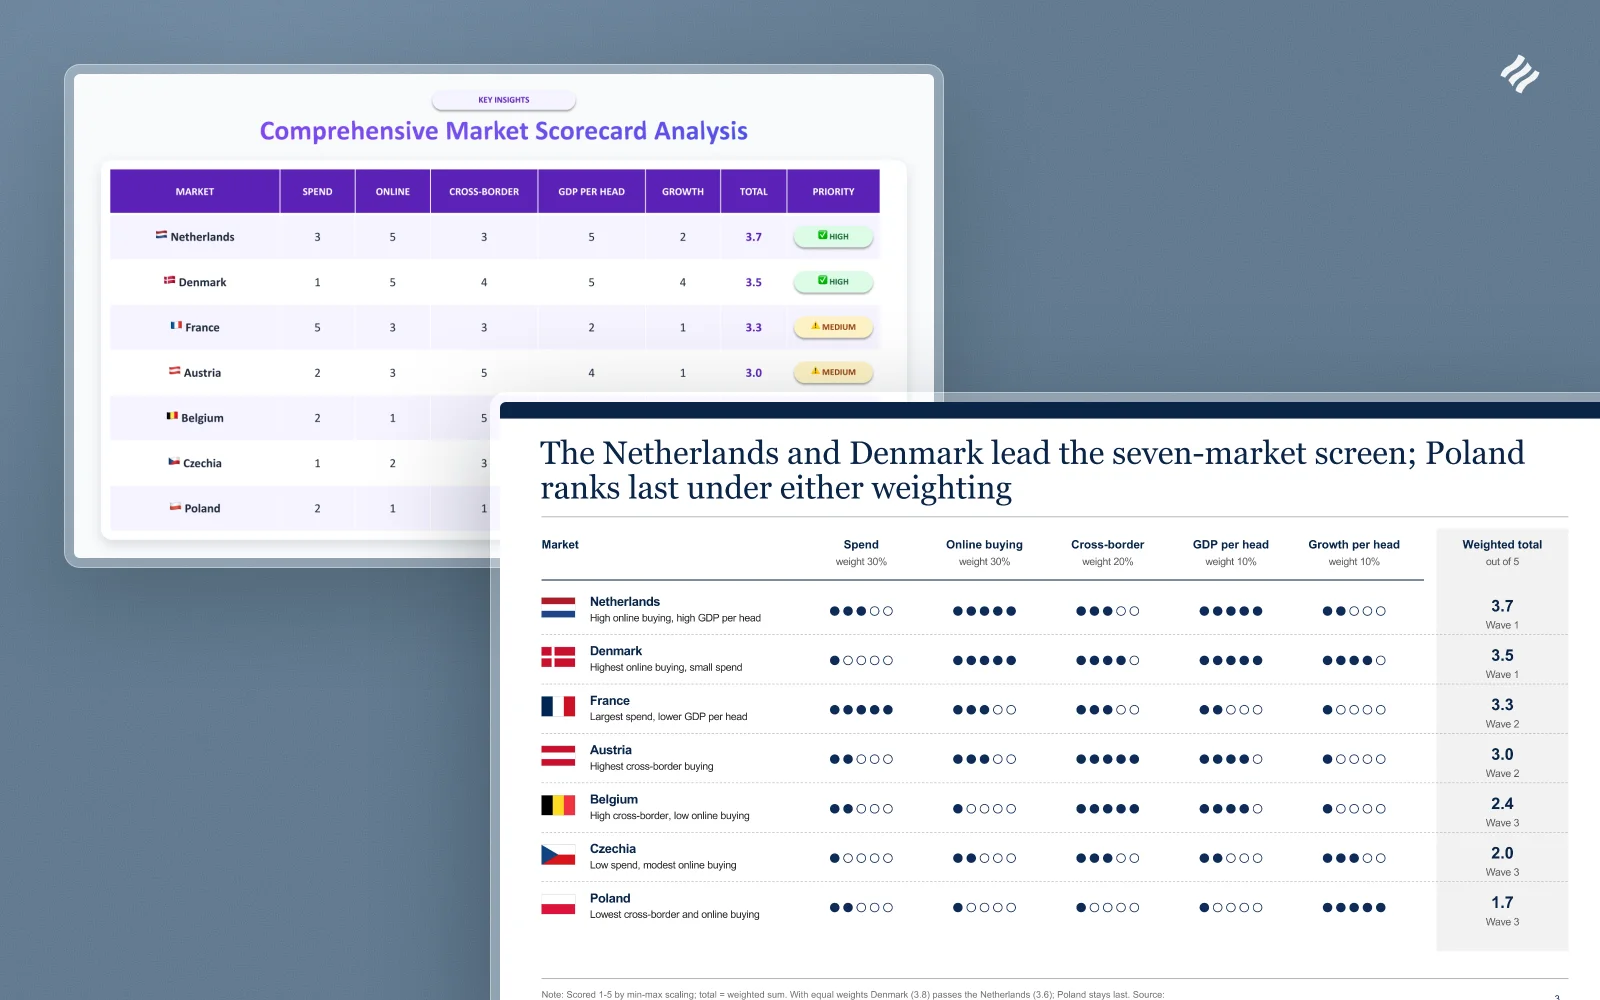
A scorecard exists to settle a ranking, so a reader should know who leads and who comes last before reading a single cell. The clean version says so in its title: the Netherlands and Denmark lead, and Poland ranks last under either weighting.
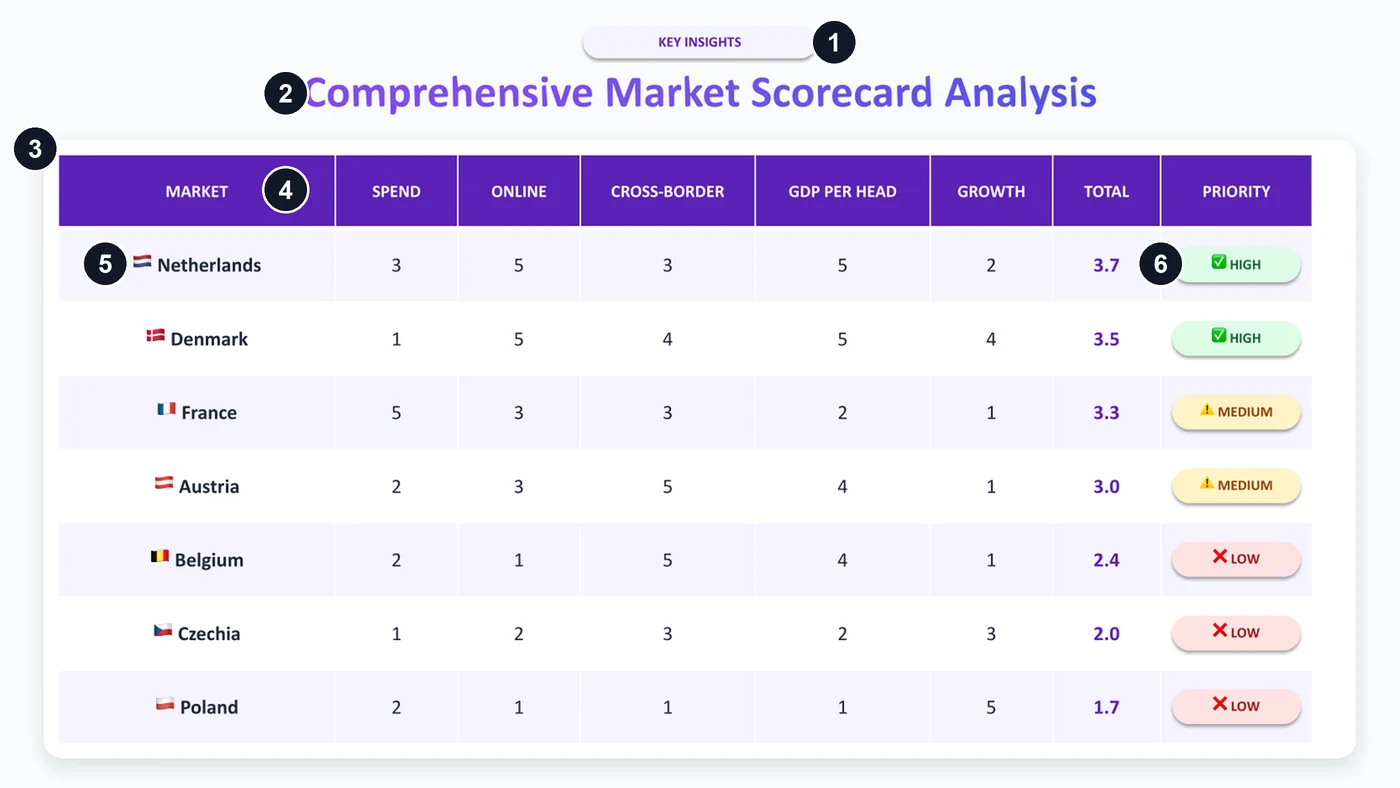
- A pill label, “KEY INSIGHTS”, above a page that states none.
- “Comprehensive Market Scorecard Analysis” in gradient text, a title with no finding in it.
- A table inside a shadowed box.
- A dark header bar in capitals.
- Flag emoji at text size and every cell centred, so no column has an edge to read down.
- Traffic-light pills with emoji, reading HIGH, MEDIUM and LOW: a category that adds nothing to the total and hides the decision.
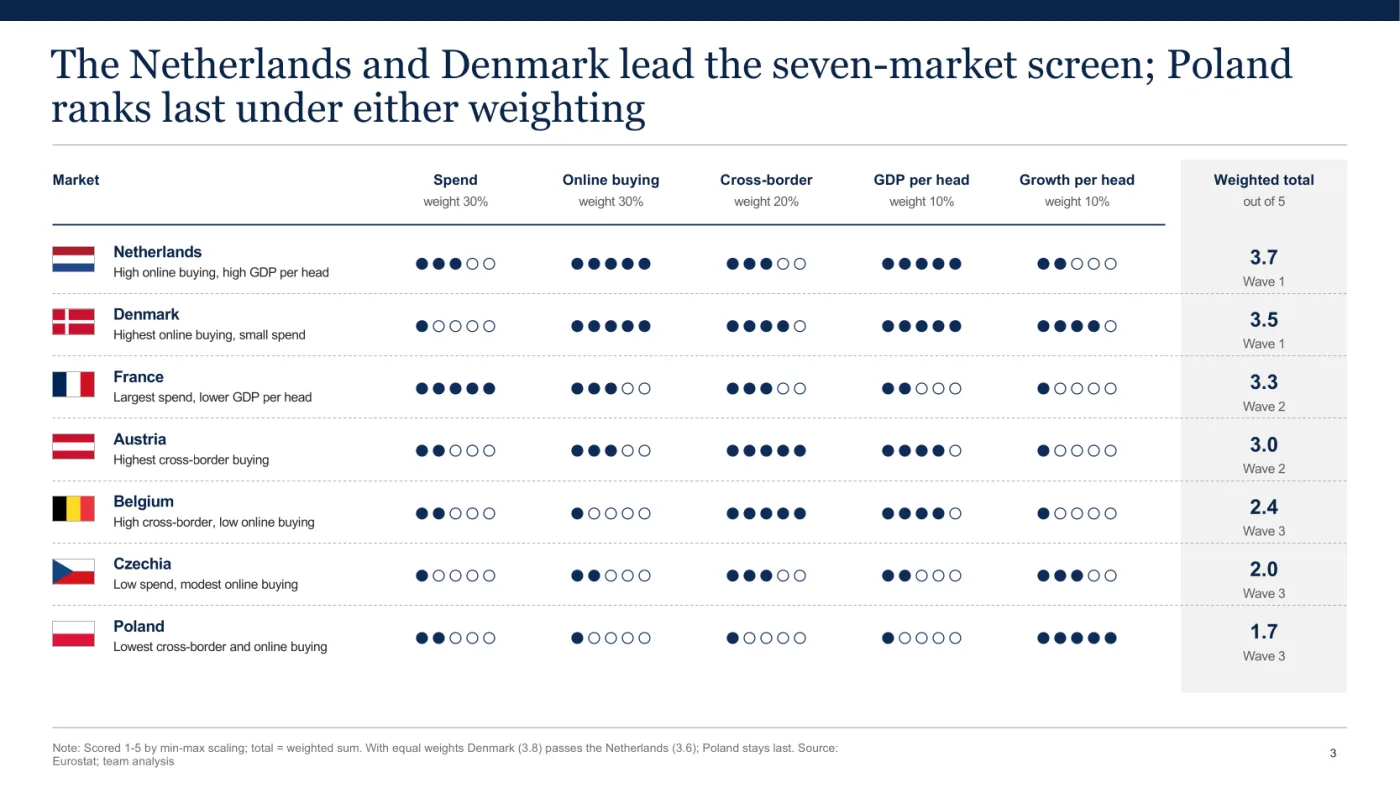
Weights sit on the header, dot ratings read at a glance, and totals and waves share one tinted column. The note holds the test a sceptic asks for: with equal weights Denmark (3.8) passes the Netherlands (3.6) and Poland stays last.
On a roadmap, time and conditions do the work
A roadmap has to say what happens when, and what must be true before the next step starts.
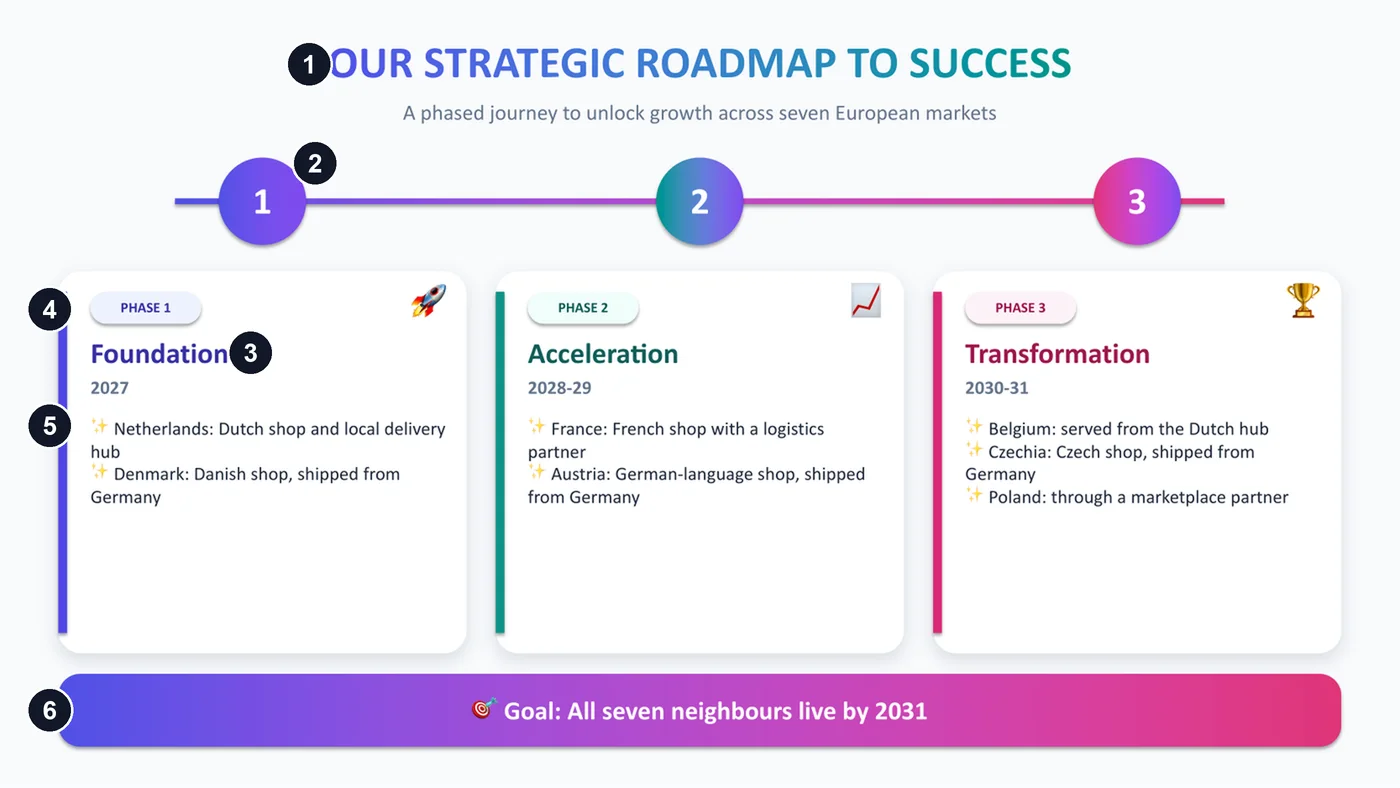
- A gradient capital title ending “to success”.
- Three evenly spaced numbered circles, with no time scale and no condition for moving on.
- Phase names that fit any project: Foundation, Acceleration, Transformation.
- A coloured stripe on each card.
- Sparkle emoji as bullets.
- A gradient banner holding the goal. A gradient on a panel can be fine; this one carries what the title should have said.
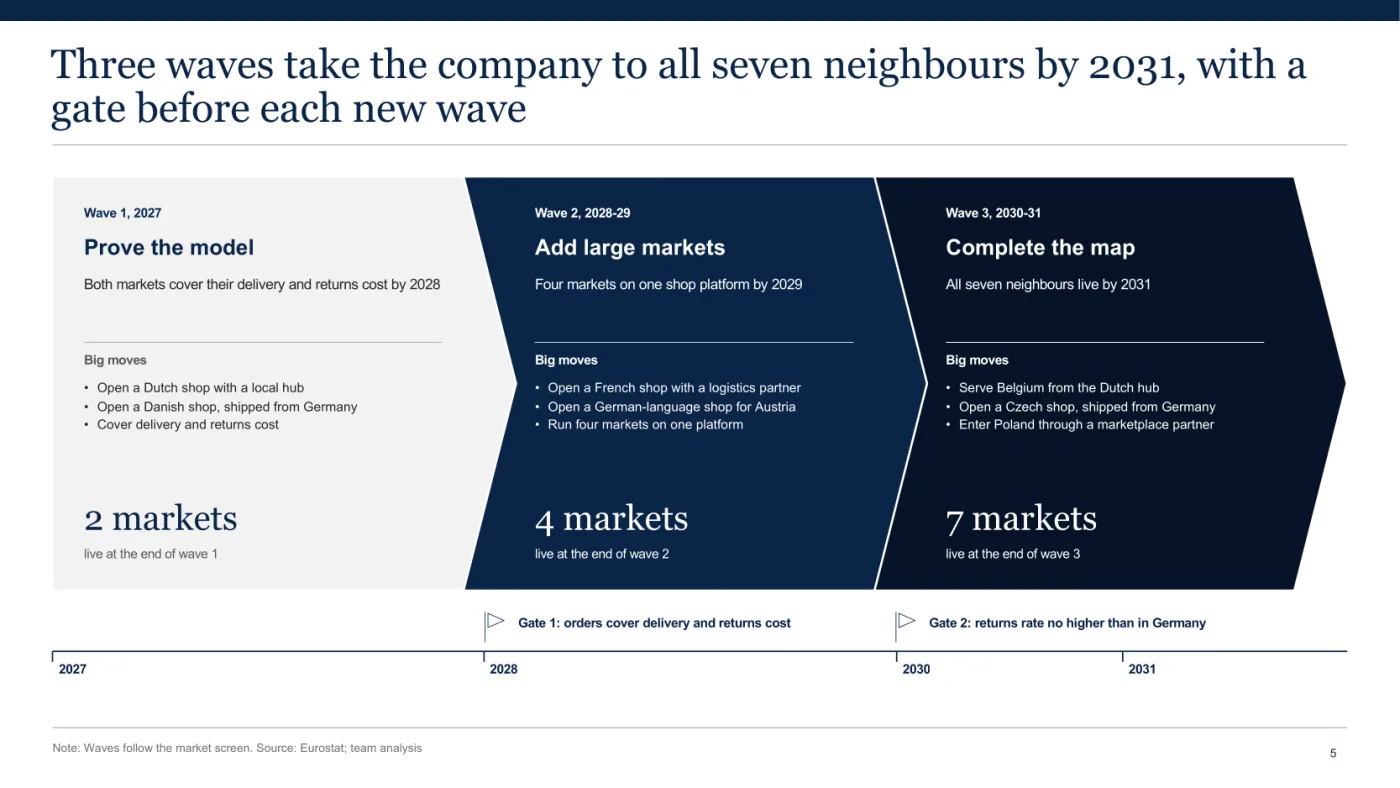
Here each wave is named by what it does: prove the model, add large markets, complete the map. The count of live markets climbs from 2 to 4 to 7. Two gates sit on a year rule that lines up with the waves: orders cover delivery and returns cost, then the returns rate abroad is no higher than in Germany.
What do real consulting slides do? A baseline from 1,703 of them
Real consulting slides have long titles, carry a lot of words and often stick to one hue. Across 1,703 content slides from public McKinsey, BCG and Bain decks, the median title has 11 words, the median slide has 170 words, and 51.8% use one hue or fewer. The clean column is the five slides of the market entry guide, four of them shown here.
| Measure | Real firm slides, n = 1,703 | Sloppy composites, n = 4 | Clean versions, built with Decky AI |
|---|---|---|---|
| Words in the title, median | 11 (66.6% have 8 or more) | 3, 4, 5, 8 | 14, 17, 18, 18, 19 |
| Title in capitals | 0.4% | 2 of 4 | 0 of 5 |
| Title centred | 0.7% | 3 of 4 | 0 of 5 |
| Words on the slide, median (quartiles) | 170 (103 to 264) | 50, 82, 86, 91 | 131, 150, 166, 166, 193 |
| Slides using one hue or fewer | 51.8% | 1 of 4 | 5 of 5 |
| Coloured pixels, median share (quartiles) | 6.7% (2.5 to 19.1) | 4.5, 9.2, 13.2, 15.3 | 4.4, 5.3, 9.6, 18.1, 18.6 |
| Blank body area, median (quartiles) | 7.3% (1.0 to 17.7) | 0, 0, 2.1, 3.1 | 0, 0, 6.3, 10.4, 17.7 |
| Body type, median pt (quartiles) | 12 (11 to 15) | 11, 13, 14, 15 | 9, 9, 10, 10, 11 |
| Source line | 42.3% | 0 of 4 | 5 of 5 |
| Page number | 91.8% | 0 of 4 | 5 of 5 |
| All-caps label of two or more words | 21.7% | 2 of 4 | 0 of 5 |
The number of hues separates real slides from the composites and the amount of colour does not: one hue or fewer on 38.0% of slides at McKinsey and 58.2% at BCG, against 1 of the 4 composites, whose coloured pixels sit inside the real quartiles. Real slides also carry far more words than the composites, and the clean versions sit near the real median.
Capitals alone prove nothing: a title in capitals is rare at 0.4%, while capital labels of two or more words appear on 21.7% of real slides. Title length only stands in for a stated finding: I counted words and did not judge 1,703 titles.
I also looked through a fixed random sample of 120 of the slides (seed 20261103), as thumbnails with the chart slides enlarged. None of the 27 enlarged chart slides had gridlines; about 10 others carry a smaller or schematic chart, and only one of those, a small radar, shows a grid. I saw no emoji used as icons or bullets and no gradient text. About 10 of the 120 had a row or grid of three or more same-size boxes holding text, so a row of boxes alone proves little, and at most 2 had rounded cards with a soft shadow.
These are public decks, often marketing reports, which differ from client work, and a few may have used AI themselves. A number describes a genre and does not prove quality, and the attribution to each firm comes from my deck list. The composite column, built on purpose, shows what the tells do and nothing about AI tools. Nor does any of this show that decoration hurts: in a small experiment by Bateman and colleagues (20 participants, 14 charts), embellished charts were read no worse than plain ones and recalled better, and the authors say “we do not advocate this strategy as a general principle”.
The ranking pages have no baseline to compare with. On 3 November 2026 a search tool returned 28 URLs for four phrasings of this query, 19 of them readable articles about slides: none measures decks made by people, and 13 come from companies selling AI slide tools, as this page does. I also found no study that counts the popular tells in AI slides against human ones, so everything here says what public firm decks do and leaves open what any tool does.
How to rerun the measurement
Take public PDF decks attributed to McKinsey, BCG or Bain, PDF creation year 2018 or later, page ratio at least 1.6: 62 decks here (25, 21 and 16). A content slide is any page of that ratio, except the first and last, with at least 30 words: 1,703 slides from 59 of the decks (867 BCG, 423 Bain, 413 McKinsey, so long BCG reports weigh heavily). Tools: poppler and Python, type sizes normalised to a slide 540 points tall. Title: largest type in the top 30% of the slide, at least 13 points, with its continuation lines; 1,621 slides have one, and the title rows count those. Centred: midpoint within 2% of the page centre, left edge past 12% of the width. Body type: word-weighted median size between 12% and 90% of the height, outside the title. Coloured pixel: HSV saturation and value above 0.25 at 30 dpi. Hue: counts when its 30-degree bin holds at least 0.5% of the slide’s pixels. Blank body area: share of a 12 by 8 grid, between 18% and 92% of the height, whose cells are more than 99.5% the page’s most common colour. Source line: the word “source” in the bottom quarter. Page number: a 1 to 3 digit number in the top 6% or bottom 12%. All-caps label: a line of two or more words outside the title, in capitals, at least six letters.
On the composites, the title, page-number and capital-label rows were read by eye and the unread titles added to the word counts, since PowerPoint’s PDF export turns gradient text into a picture.
Three of the measured decks, one per firm: Bain’s India Venture Capital Report 2024, BCG’s True-Luxury Global Consumer Insight 2018 and McKinsey’s SDG Guide for Business Leaders, on vl.dk because none of the measured McKinsey decks sat on the firm’s own site.
Can people tell a deck was made by AI?
Not reliably once the obvious defects are gone, going by the fuller of two classroom studies I found on slides. Leinonen and colleagues had students in a university web programming course rate AI-made and instructor-made slide segments. Quality came out alike (median 5.0 of 7 for both, p = 0.84), and the students could not reliably guess the source (median guess 4.0 for both, p = 0.1).
To blind the test, though, the authors matched the AI slides to the instructor’s format and cut parts of them before students saw them, so the visual tells had been removed first. It was one course with 88 enrolled, on teaching slides, in late 2025. The fair reading is that students could not tell once a person had fixed the style. A smaller 2024 study (abstract only, no statistics) fits that reading: in a physical therapy programme where student groups presented with and without AI, the students all identified the AI presentations, by their wordiness and by how the groups presented.
In the Leinonen study, higher-rated slides were guessed as human more often (Spearman -0.28, p < 0.01), and the authors say the human-made set most often guessed as AI likely suffered from code on a slide that did not display correctly. Defects seem to read as AI whoever made them, so fixing them pays off whoever built the deck.
I know of no reliable detector for slides. A restyled slide can pass as human and still say nothing, so evading detection is the wrong goal. Aim for a slide a reader can act on and check.
Frequently asked questions
Why do AI presentations look the same?
Shared tool defaults probably play a part, though I found no study that shows the cause for slides. Kommers and colleagues describe slop flattening individual variation into canonical patterns.
Can a prompt remove the AI look?
Partly, and I found no study that tests it. A prompt can carry your finding, your numbers and your style guide, which helps the argument most. One vendor reports that telling a model to avoid one default moves it to the next, which I have not measured. Your master and your analysis are firmer ground.
What should you fix first in an AI-made deck?
The titles and the numbers. Rewrite each title as the finding, then trace each figure to its source, because those are what a reader acts on and can check. Colour and layout come after. A plain page with the right number beats a polished page with the wrong one.
Six checks for AI slop that outlast the next model
These six checks test what a slide says and how it was built, so they keep working when a tool’s default look changes.
- Read the titles alone, in order. They should tell the argument by themselves. UK government chart guidance says “The headline title should communicate the headline message of the chart”. In an experiment with 110 engineering students, sentence headlines over visual evidence beat PowerPoint’s default slides on comprehension (Cohen’s d = 0.81 on essay scores), though co-author Michael Alley is the approach’s long-time advocate.
- Trace every number to a source. Pick any figure and find the page it came from. The same UK guidance asks for the specific data source, with a link where possible.
- Open each chart as a chart. Click it and look for Edit Data. If PowerPoint offers it, the numbers behind the bars can be read and changed; a picture of a chart offers neither.
- Check that the slide sits on your master. Microsoft’s guide to the slide master says a change to fonts or logos there reaches every slide based on it. So change the title font on the master and watch. The same page says existing slides may need their layout reapplied, so if this slide stays put after that, it is not following your master.
- Count the hues and say what each one means. If a colour encodes nothing, take it off. On real slides, 51.8% use one hue or fewer.
- Swap in another company’s name. If the slide still reads as true, it has no finding yet. “A strategic path forward” fits anyone, and “Enter the Netherlands and Denmark first in 2027” fits one company.
A deck can pass all six and still rest on bad analysis, which no check of this kind catches.
Decky AI is built for clean slides in PowerPoint
The clean slides in this post are what Decky AI is built for, once the analysis exists and the deck is the slow part. Its add-in works in the PowerPoint file you have open, with no separate editor and no export step.
Five of the six checks have an answer in how it builds. With the consultant working style, titles come out as sentences that state the finding. Quantitative slides carry a source line, and when it fills a template from its library of designed consulting templates, a fact your material lacks shows up as a visible “to confirm” placeholder. Charts arrive as PowerPoint charts you can edit. New slides are built from your template’s own layouts, fonts and colours. Its slide prompts carry a short list of defaults, one accent colour, no eyebrow labels, no grids of identical cards and no chart pictures, and your request, your style guide and your master take priority over them.
The sixth check is the finding, and that part is yours. Bring the markets, the weights and the numbers, and Decky AI does the page work: the clean slides here came from a brief that already held them, and the market entry guide prints it in shortened form.
If you have the numbers and a master, try it against your own template.

Maximilian Nitsche · Founder, Decky AI
I built Decky AI so anyone can put an MBB-level slide together and still be done before 8pm. I write here about the craft of consulting decks, and about what we ship.